

Your LinkedIn engagement rate is the single clearest signal of whether your content is working. Follower counts look good on a profile, and impressions tell you how far a post traveled, but neither answers the question that actually matters: when people see your content, do they care enough to interact with it? The engagement rate answers that question with a single number, and it's the metric every serious LinkedIn creator tracks more closely than anything else.
The problem is that "good" means different things depending on who you ask. A marketing agency managing a company page with 200,000 followers will celebrate a 1.5% rate that would terrify a personal-brand coach with 3,000 followers. The numbers shift depending on industry, content format, audience size, and even the time of day you post. Without context, your engagement rate is just a number that doesn't tell you whether to celebrate or panic.
This article breaks down everything you need to make that number useful. You'll learn what LinkedIn counts as engagement, how to calculate the rate yourself (or use a free LinkedIn engagement rate calculator), what the current 2026 benchmarks look like by industry and content type, and seven specific ways to improve your rate starting with your next post. LinkedGrow is a LinkedIn content creation and scheduling platform that tracks your engagement metrics automatically, but the formulas and benchmarks below apply regardless of the tools you use.
If you're just here for the quick answer: most LinkedIn accounts should aim for 2% to 5%, with anything above 5% considered strong and 6% or higher putting you in top-tier territory. The rest of this article explains why those numbers exist and how to push yours toward the upper end.
We'll also cover why your engagement rate naturally drops as your audience grows (and why that's completely normal), so you don't mistake a healthy trend for a content problem that needs fixing. Every creator who grows past a few thousand followers deals with this, and understanding the math behind it saves a lot of unnecessary panic.
What counts as engagement on LinkedIn?
LinkedIn counts six types of interactions as engagement: reactions (like, celebrate, support, insightful, funny, love), comments, shares, reposts, clicks on the post content (including "see more" expansions, image clicks, link clicks, and profile clicks), and follows that happen directly from the post. Every one of these actions feeds into the engagement number you see in your post analytics.

Not all engagement actions carry equal weight in the algorithm. Comments are the most valuable because they require the most effort and signal genuine conversation. A post that gets 15 comments will almost always reach more people than a post with 50 reactions and zero comments, because the algorithm interprets comments as a sign that the content sparked discussion worth distributing further. Shares and reposts are next, because they expose the content to an entirely new audience.
Reactions are the lowest-effort action and carry the least algorithmic weight, but they still count as engagement and contribute to your rate. Clicks are interesting because LinkedIn counts them in your total engagement number, yet the platform actively penalizes posts that include external links by showing them to fewer people. So a link post might have a decent click-through rate on paper but a low overall engagement rate because the post never reached many people in the first place.
One often-missed detail is that "see more" clicks count as engagement too. When someone taps to expand your post, LinkedIn records that as a click, even though the person hasn't reacted, commented, or shared anything yet. This is why longer posts that require the "see more" expansion sometimes show inflated engagement numbers compared to shorter posts that display in full without any click needed. The engagement is real (someone chose to read more), but it doesn't carry the same weight in the algorithm as a comment or share.
What LinkedIn does not count as engagement: viewing the post without interacting (that's an impression, not an engagement), saving the post, sending it in a direct message, or screenshotting it. LinkedIn's analytics also separate organic engagement from paid engagement if you run sponsored content, so the rate you see on a boosted post may look different depending on which tab you're viewing. For the purposes of this article, every benchmark and formula refers to organic engagement unless stated otherwise.
How do you calculate your LinkedIn engagement rate?
The standard LinkedIn engagement rate formula divides total engagements by total impressions and multiplies by 100. If a post gets 85 engagements (combining reactions, comments, shares, and clicks) and 3,400 impressions, the engagement rate is (85 / 3,400) x 100 = 2.5%. This is the formula LinkedIn itself uses in its native analytics dashboard, and it's the one you should default to when comparing your numbers against any benchmark.

Some third-party tools use a different denominator: follower count instead of impressions. That formula is (total engagements / total followers) x 100. The follower-based formula will always produce a lower number for the same post, because not all of your followers see every post you publish. On LinkedIn, organic reach typically sits between 3% and 10% of your total followers, so dividing by the full follower count deflates the result. Neither formula is wrong, but you can't compare an impressions-based rate with a follower-based rate and expect the numbers to mean the same thing.
To find your numbers manually, go to any post you've published, click on the analytics bar below the post (the one that shows impressions), and LinkedIn will show you the breakdown: impressions, reactions, comments, reposts, and other engagement. Add up all the engagement actions, divide by impressions, and multiply by 100. You can do this for individual posts or calculate an average across your last 10 to 20 posts for a more reliable baseline.
If you don't want to do the math by hand, LinkedGrow's free engagement rate calculator lets you plug in your impressions and engagement numbers and get the result instantly. It also tells you where your rate falls compared to 2026 benchmarks, so you know immediately whether your number is average, strong, or below par.
The most useful approach is to track your average engagement rate weekly rather than obsessing over individual posts. A single viral post can spike your rate to 15%, and a single post that falls flat might drop to 0.5%, but neither is representative. Your rolling 4-week average is the number that actually tells you whether your content strategy is improving, holding steady, or declining.
What's a good LinkedIn engagement rate in 2026?
A good LinkedIn engagement rate in 2026 sits between 2% and 5% for most personal accounts. Anything consistently above 5% is strong, and sustaining 6% or higher over a full month puts you well above average. Company pages typically run lower, with 1% to 3% considered normal, because brand content tends to attract fewer comments and reactions than personal posts. According to Hootsuite's cross-industry benchmarks, the average across all industries is around 3.4%, though that number blends personal accounts and company pages together.
Rates vary significantly by content format. Document posts (carousels and PDF slides) and multi-image gallery posts consistently outperform other formats because the swipe mechanic keeps people on the post longer, which the LinkedIn algorithm interprets as a quality signal. Video posts come next, followed by single images and plain text. The difference is meaningful: a carousel post might average 5% to 7% engagement while a text-only post on the same topic from the same account might land between 2% and 3%.
Industry also moves the needle. Accounts in consulting, coaching, marketing, and SaaS tend to post content that naturally invites discussion (opinions, frameworks, case studies), so their average rates skew higher. Accounts in regulated industries like financial services, healthcare, or legal often post more cautious, compliance-reviewed content that generates fewer comments, pulling their average closer to the 2% floor. The key comparison isn't your rate versus a random benchmark table, it's your rate versus others in your specific space talking to a similar audience.
Follower count is the third major variable. Accounts with fewer than 5,000 followers often see engagement rates between 4% and 8% because their audience is small, concentrated, and personally connected. As follower count grows past 10,000, rates typically settle between 2% and 4%. Accounts with 50,000 or more followers often operate between 1% and 3%, even when the content is excellent, simply because a larger audience includes more passive followers who scroll past without interacting. This natural decline is normal and doesn't mean your content is getting worse.
The practical takeaway is to set your target based on your current situation rather than chasing a single universal number. If you have 2,000 followers and your average is 3%, your goal should be 4% to 5%. If you have 30,000 followers and your average is 2.5%, that's already healthy, and pushing for 3% would be a meaningful improvement. Context makes the benchmark useful, otherwise it's just a number.
How do you improve your LinkedIn engagement rate?
Improving your LinkedIn engagement rate comes down to two things: getting a higher percentage of viewers to interact with your post, and making sure the algorithm shows your content to people who are likely to interact. Everything below targets one or both of those goals.

The most immediate fix is your hook, because the first 2 to 3 lines of your post (roughly 210 characters) are what people see before they decide to click "see more" or keep scrolling. A strong LinkedIn hook creates a curiosity gap, states something counterintuitive, or opens with a specific number that makes the reader want context. "I stopped posting daily and my engagement doubled" is a better hook than "Tips for improving your LinkedIn engagement" because the first one raises a question the reader wants answered.
Post format matters more than most people realize. If you're publishing text-only posts every day and wondering why your rate stays flat, the format is your biggest lever. Carousel documents keep people swiping, which increases dwell time and tells the algorithm the content is worth showing to more people. Multi-image posts create a similar effect. Mix in at least one or two carousels per week alongside your text posts, and you'll likely see your average rate climb within a few weeks. LinkedGrow's carousel generator can turn any text post into a swipeable document in a few clicks, which makes format switching easy even if you don't have design skills.
Posting frequency has a direct relationship with engagement rate, but not in the way most people expect. Posting once per day, 4 to 5 times per week, tends to produce the best balance between reach and engagement. If you post twice in one day, the second post usually cannibalizes the first because LinkedIn limits how much of your content it shows to the same audience in a single day. If you post fewer than 3 times per week, each individual post might get a decent rate, but your overall visibility drops because the algorithm favors consistency. You can read more about the data on posting frequency in the full breakdown.
End every post with a conversation starter, not a link. Posts that close with a question ("What's your experience?" or "Which of these has worked best for you?") generate more comments than posts that close with a link to a blog or landing page. If you need to include a link, put it in the first comment instead of the post body so the algorithm doesn't penalize your reach. LinkedGrow's scheduling feature lets you draft the first comment alongside the post and publish both at the same time, so the link is ready immediately without hurting distribution.
Reply to every comment on your posts within the first 60 minutes. The first hour after publishing is when LinkedIn decides whether to push the post to a wider audience, and comment activity during that window is the strongest signal. Each reply you write counts as an additional comment, which doubles the engagement count from every person who comments. A post with 10 comments and 10 replies (20 total) gets significantly more distribution than a post with 10 comments and zero replies.
Timing also plays a role, though it's less important than the content itself. Most LinkedIn audiences are most active between 7:30am and 9:00am in their local time zone on Tuesday through Thursday. If your audience is primarily in one timezone, schedule your posts to land during that window. If your audience is global, pick a time that catches the start of the European workday and the end of the US East Coast morning for maximum overlap. You can check optimal timing with the best time to post tool for more specific guidance.
The last lever is topic relevance. Posts about topics your audience actually cares about will always outperform posts about topics you think they should care about. If you're a marketing consultant and your highest-engagement posts are about client acquisition while your thought-leadership essays about industry trends get almost no engagement, the data is telling you something. Double down on what works, test variations of your best-performing topics, and stop forcing content types that your specific audience consistently ignores. LinkedGrow's analytics dashboard makes it easy to spot these patterns by showing engagement trends across your post history.
Why does your engagement rate drop as you grow?
Almost every LinkedIn creator notices the same pattern: the engagement rate was higher when they had fewer followers, and it gradually declined as their audience grew. This isn't a sign that the content got worse or that the algorithm turned against you. The decline is a statistical inevitability that happens on every platform, and understanding it prevents you from making bad decisions based on a misread.
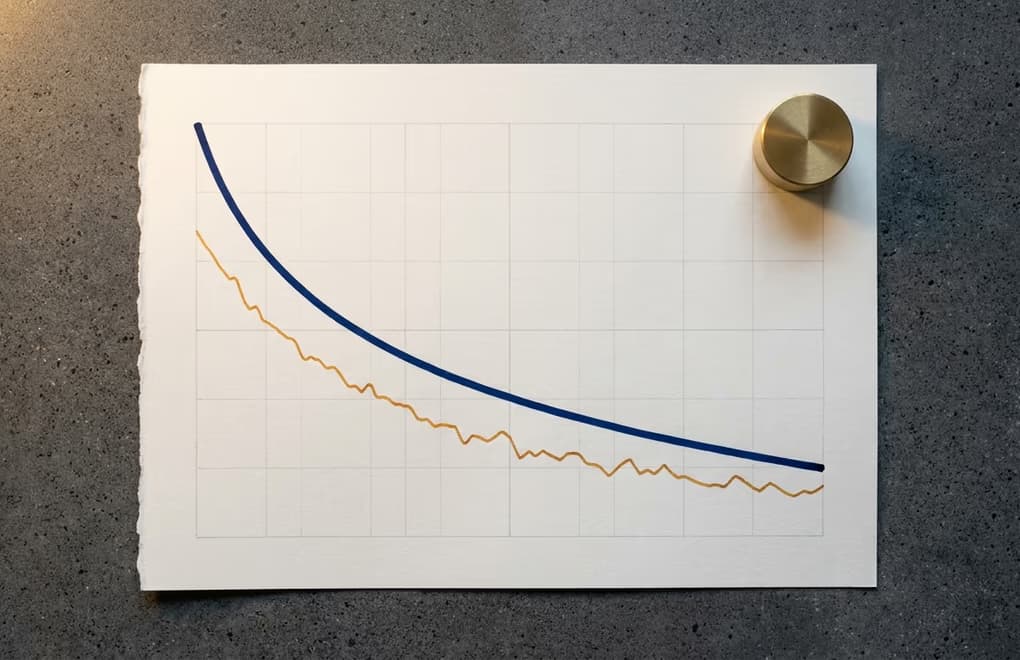
When you have 500 followers, most of them know you personally or followed you because they genuinely want your content. They comment because they feel a connection. When you have 20,000 followers, a large portion followed you after seeing a single viral post, and many of them never interact again. The denominator (impressions) grows faster than the numerator (engagements), and the rate falls as a result.
LinkedIn's algorithm also distributes content differently at different audience sizes. For smaller accounts, the algorithm shows posts to a higher percentage of followers because there are fewer people to choose from. For larger accounts, LinkedIn is more selective about who sees each post, testing it with a subset before deciding whether to push it wider. This filtering means that even strong content from a large account might only reach 5% to 8% of followers, while the same quality content from a small account might reach 20% to 30%.
The right response to a declining rate isn't to chase the old number. Instead, shift your attention to absolute engagement counts alongside the rate. A 2% rate on a post that reached 10,000 people (200 engagements) is worth more than a 7% rate on a post that reached 500 people (35 engagements). Both numbers matter, but the absolute count tells you how many real people interacted with your work. As your audience grows, track both the rate and the raw count, and use the rate primarily to compare your own posts against each other rather than against an outdated personal benchmark.
One practical guardrail: if your rate drops below 1% on a personal account or below 0.5% on a company page, something is genuinely off. At those levels, the content probably isn't resonating with the audience you've built, and it's worth revisiting your topic mix, posting format, or whether your audience has shifted away from the niche you're writing about. A gradual decline from 5% to 3% as you grow from 2,000 to 15,000 followers is normal. A sudden drop from 3% to 0.8% without a follower spike usually means the content or timing needs attention.
Track what matters, ignore the noise
Your LinkedIn engagement rate is one of the few metrics that directly reflects whether your content connects with the people seeing it. Know the formula, understand where your number falls compared to accounts like yours, and track the trend over weeks rather than fixating on any single post. The accounts that sustain strong engagement rates don't have a secret algorithm hack; they post relevant content consistently, respond to comments quickly, and adjust their strategy based on what the data shows rather than what feels right.
If you want to track your engagement rate without a spreadsheet, LinkedGrow monitors your LinkedIn content performance, including engagement trends by post type, and helps you create higher-performing content with AI voice training and hook optimization. You can try it free for 7 days with no credit card required.
Frequently asked questions about LinkedIn engagement rate
A good LinkedIn engagement rate falls between 2% and 5% for most accounts. Anything above 5% is strong, and consistently reaching 6% or higher puts you in the top tier of LinkedIn creators. Accounts with fewer than 5,000 followers tend to see higher rates because their audience is more concentrated, while accounts with 50,000 or more followers typically see rates between 1% and 3% because their content reaches a broader, less targeted audience.
LinkedIn's native analytics use impressions as the denominator. The platform divides total engagements (reactions, comments, shares, and clicks) by total impressions, then multiplies by 100. This is different from some third-party tools that divide by follower count instead. The impressions-based formula gives a more accurate picture of how your content performed with the people who actually saw it, rather than measuring against your entire follower base.
LinkedIn counts clicks on links, images, and your profile as engagement actions. However, posts with external links tend to get fewer impressions because the algorithm deprioritizes content that sends people away from the platform. The click itself counts, but the reduced reach usually means your overall engagement numbers are lower on link posts compared to native content like text posts, carousels, or videos.
Engagement rates naturally decline as your follower count grows because each new follower is slightly less connected to you than the previous one. Your earliest followers are colleagues, friends, and people who actively chose to follow you, so they interact more. As your audience expands beyond that core group, the average engagement per impression drops. Posting frequency also plays a role, because posting more than once per day can split your audience across posts and lower the rate on each individual piece of content.
Document posts (what most people call carousels) consistently outperform single-image and text-only posts on engagement rate. The swipe mechanic keeps people on the post longer, which signals to the algorithm that the content is valuable, leading to more distribution. Multi-image posts (the native image gallery format) tend to get the highest engagement rates of any format, followed by document carousels and then video. Single images and text-only posts typically have the lowest engagement rates, though they can still perform well with a strong hook and relevant topic.
The post you keep meaning to write takes four minutes here.
LinkedGrow turns a link, a video or a rough idea into a LinkedIn post written in your own voice, then puts it in the calendar for the morning your audience is awake.
Start free for 7 days