You published a LinkedIn post this morning and checked back an hour later to find it had 4,200 impressions. Sounds great, right? But then you notice the post only received 12 reactions and a single comment. Something about those numbers feels off, and if you are being honest, you are not entirely sure what an impression on LinkedIn even measures in the first place. You are not alone - it is one of the most commonly misunderstood metrics on the platform, and misreading it leads to bad content decisions that quietly stall your growth for months. LinkedGrow tracks all of these analytics in one dashboard, but before the numbers become useful, you need to understand what they actually represent.
The confusion gets worse because LinkedIn uses several related terms - impressions, views, reach, engagement rate - and each one measures something different. People treat them interchangeably in conversation, which means advice like "aim for 10,000 impressions per post" or "your engagement rate should be above 3 percent" can mean completely different things depending on who is saying it and which metric they are actually looking at. If you have ever wondered why two posts with the same impression count can produce wildly different results for your business, this is the article that will make it click.
This guide breaks down what LinkedIn impressions actually are, how they differ from views and reach, what counts toward your engagement rate, and how to use all of this data to make smarter content decisions. We will cover the technical definitions straight from LinkedIn's own documentation, the recent changes that inflated everyone's numbers, and the practical framework for turning raw impression data into content that grows your audience and drives real conversations.
What is an impression on LinkedIn?
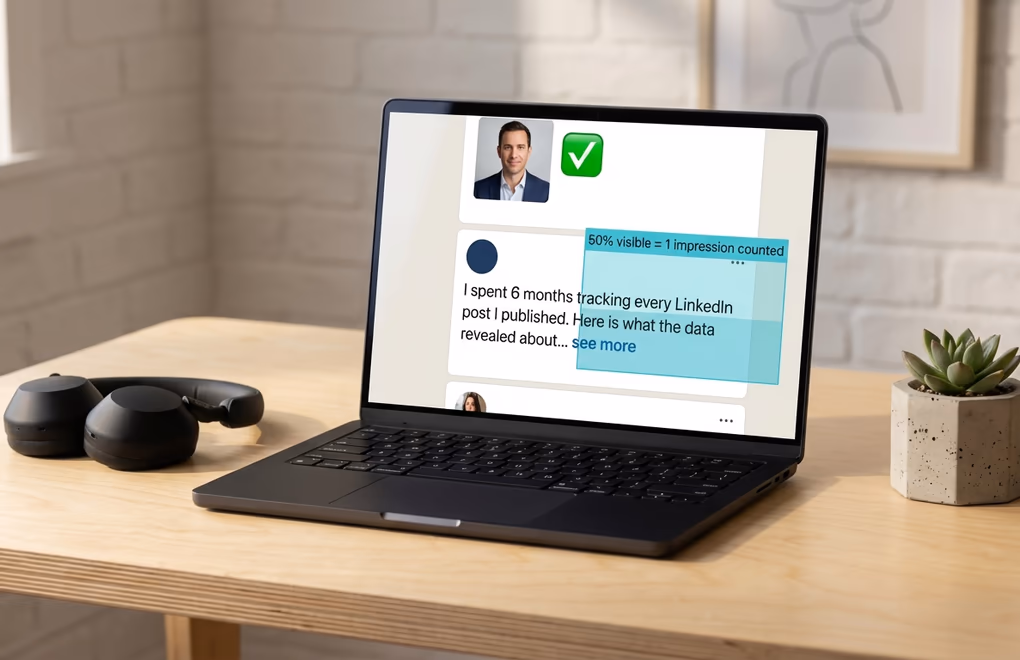
An impression on LinkedIn is counted every time your post appears on someone's screen, and the technical threshold is more specific than most people realize. According to LinkedIn's official help documentation, a post registers an impression when at least 50 percent of it is visible on a signed-in member's device screen for at least 300 milliseconds. That is three-tenths of a second. So if someone scrolls their feed and your post flashes past quickly enough that less than half of it was showing, that technically does not count. But realistically, even a fast scroll past a post that pauses briefly will trigger an impression because 300 milliseconds is not much time at all.
The important thing to understand about impressions is that they are not deduplicated. If the same person sees your post three times because it kept reappearing in their feed at different points during the day, that counts as three impressions. This is fundamentally different from "reach," which we will get to in the next section, and it explains why your impression count can be significantly higher than the number of actual people who saw your content. A post with 5,000 impressions might have been seen by 3,200 unique people, with the remaining 1,800 impressions coming from repeat appearances.
One change that still catches people off guard is that impressions now include views that come from reposts of your content. If someone shares your post with their network and their followers see it, those impressions get added to your total count. Before LinkedIn rolled this out, repost impressions were tracked separately, and your impression number only reflected direct distribution from the algorithm. This single update inflated impression counts across the platform practically overnight, which is worth keeping in mind if you are comparing your numbers today to anything from a couple of years ago.
LinkedIn also distinguishes between three types of impressions, though the platform does not break these out separately in your post analytics. Organic impressions come from the algorithm naturally distributing your content to people who might find it relevant. Viral impressions happen when your post breaks out of your immediate network through high engagement, comments, and reposts, reaching second and third-degree connections. And paid impressions come from boosting or sponsoring your content through LinkedIn's advertising tools. When you see your total impression count on a post, it is a blend of all three, which is why a post that gets heavily reposted can show a much higher impression count than one with a similar number of direct reactions.
What's the difference between impressions, views, and reach on LinkedIn?
The reason these three terms cause so much confusion is that they all seem to answer the same question - how many people saw my post? - but they each measure something fundamentally different. Getting them mixed up leads to bad assumptions about your content performance, so it is worth spending a minute getting the definitions straight before you start optimizing anything.
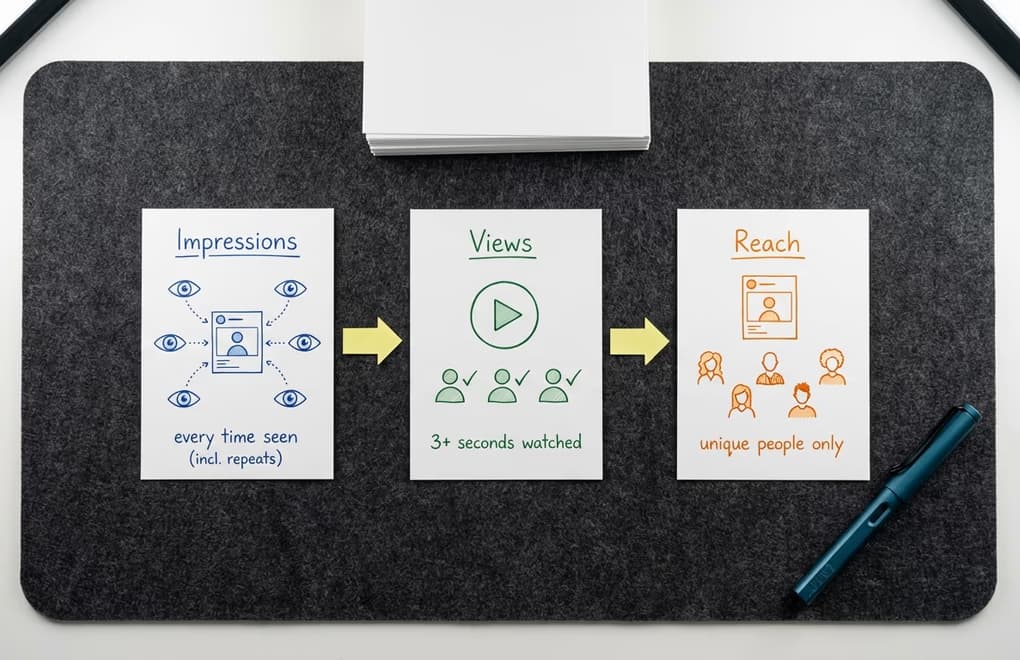
Impressions count the total number of times your post appeared on screens, including repeats. As we covered above, the same person seeing your post on three separate occasions adds three to your impression count. Think of it like a billboard on a highway - every car that drives past it counts, even if the same driver takes that route twice a day. It is a volume metric that tells you how much exposure your content received, but it does not tell you how many unique people were exposed to it.
Reach, which LinkedIn labels as "Members reached" in company page analytics, counts the number of distinct members and Pages that saw your post without counting repeat displays. This is always going to be equal to or lower than your impression count because it removes the duplicates. If 200 unique people saw your post but 60 of them saw it twice, your reach is 200 while your impressions are 260. Reach gives you a more honest picture of how many actual humans encountered your content, though LinkedIn currently only shows this metric prominently for company pages rather than personal profiles.
Views work differently and are used for specific content types. For video content, a view requires the viewer to watch at least three seconds, which is a much higher bar than the 300-millisecond impression threshold. For articles and newsletters, a view means someone actually clicked through to read the content rather than just seeing the preview card in their feed. This distinction matters because views represent intentional consumption while impressions include passive exposure. A post with 10,000 impressions and 800 views means that only about 8 percent of the people who saw it in their feed actually stopped to engage with the content itself.
The practical takeaway is that impressions tell you about distribution, reach tells you about audience size, and views tell you about intent. When you are evaluating whether a post performed well, looking at just one of these numbers in isolation gives you an incomplete picture. A post with high impressions but low reach means the same people saw it multiple times. A post with high reach but low views means it reached a lot of people who chose not to engage. The most useful metric for most LinkedIn creators is the ratio between these numbers, and that is where engagement rate comes in.
What is a good LinkedIn engagement rate in 2026?
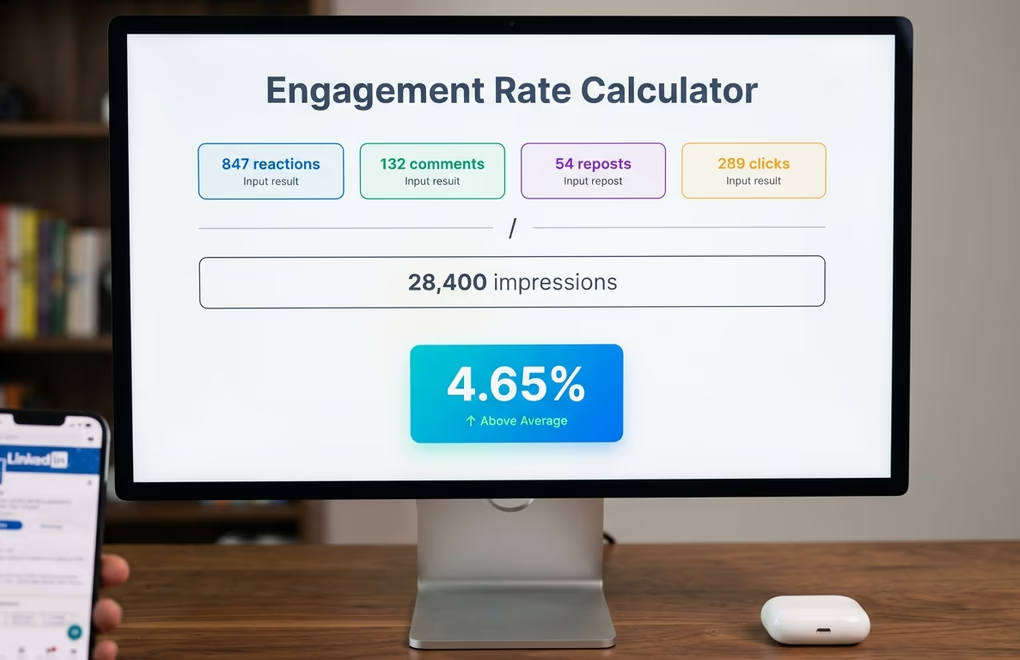
Your engagement rate is the single most useful number you can track on LinkedIn because it tells you what percentage of the people who saw your content actually did something about it. The formula is straightforward: take your total engagements - that includes reactions, comments, shares, and clicks - divide by your total impressions, and multiply by 100. A post with 500 engagements and 10,000 impressions has a 5 percent engagement rate. You can calculate this manually for any post, or use LinkedGrow's free engagement rate calculator to do the math instantly.
So what counts as a good rate? There is no universal answer because it depends heavily on your content format, your audience size, and your industry. That said, there are general ranges that give you a useful benchmark. An engagement rate between 3 and 6 percent is considered above average and means your content is landing well with your audience. Anything above 6 percent puts you in the top tier, though you will see this most often with smaller, highly engaged audiences. Below 1.5 percent means your content is reaching people but not giving them a compelling reason to interact, and if you are consistently below 0.5 percent, something fundamental about your approach needs to change.
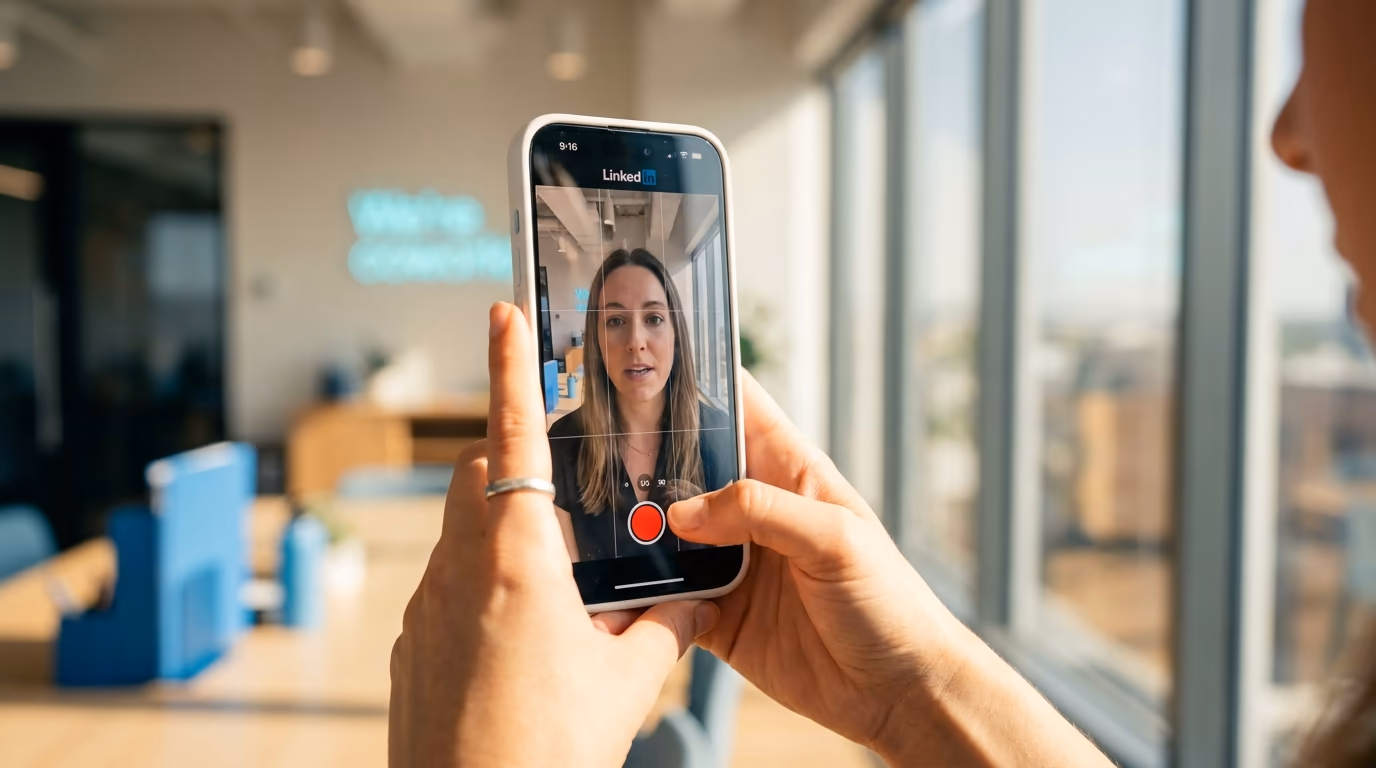
Content format has a bigger impact on engagement rate than most people realize. Document posts and carousels tend to earn the highest rates because the swipe interaction creates a micro-commitment that keeps people on your content longer. Video performs well too, particularly when it hooks viewers in the first three seconds. Single-image posts sit in the middle of the pack, and text-only posts can perform surprisingly well if the writing is strong and the hook is compelling. Link posts - where you share an external URL - consistently earn the lowest engagement rates because LinkedIn's algorithm deprioritizes content that sends people off the platform.
Account size also plays a meaningful role here that catches a lot of creators off guard. If you have a smaller following, say under 5,000 connections, your engagement rate will naturally be higher because you are reaching a tighter, more interested audience. As your following grows into the tens of thousands, your rate will typically drop even if your content quality stays the same, because a larger audience includes more passive followers who see your posts but rarely interact. This is completely normal and does not mean your content is getting worse - it just means your distribution is getting wider, and a portion of that wider audience is not your ideal reader.
The important habit is to track your engagement rate over time and compare it against your own baseline rather than someone else's numbers. If your average engagement rate is 3.5 percent and a particular post hits 7 percent, that tells you something worked well in that post regardless of what anyone else's benchmarks say. Pay attention to which topics, formats, and hooks consistently produce above-your-average rates, and do more of whatever those patterns reveal. That kind of data-driven iteration is far more valuable than chasing someone else's generic benchmark, and it is exactly what personal brand building on LinkedIn looks like when done properly.
What affects your LinkedIn impression count?
Understanding what drives impressions up or down gives you the ability to stop guessing and start making deliberate choices about your content. The LinkedIn algorithm evaluates hundreds of signals when deciding how widely to distribute a post, but a handful of factors carry outsized weight, and these are the ones worth paying attention to.
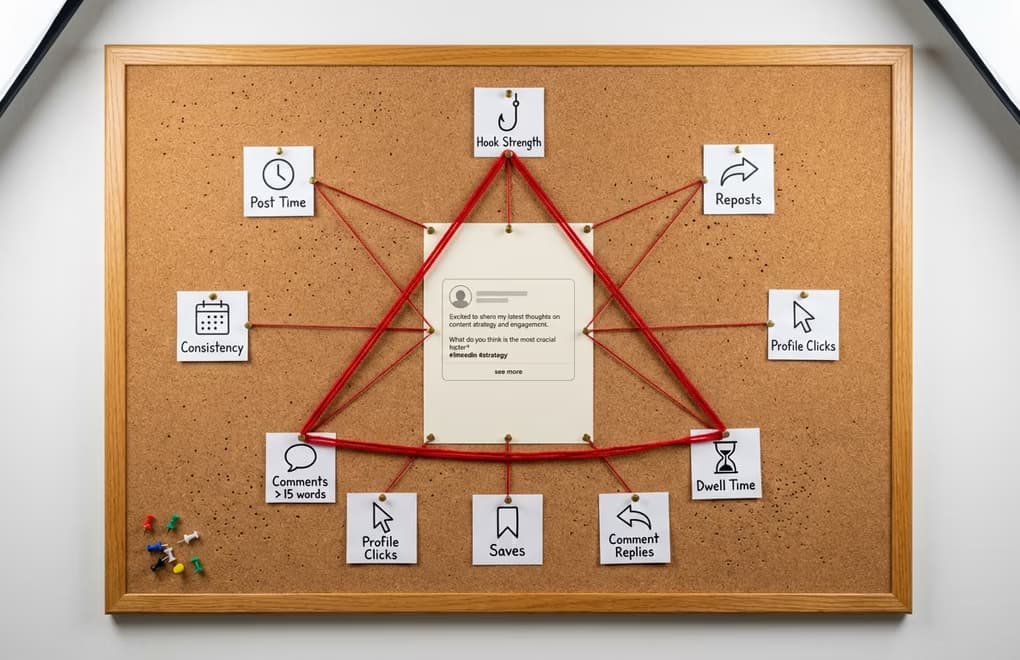
Your hook determines whether the golden hour goes well or badly. LinkedIn shows the first two lines of your post before truncating it with a "see more" button. If those two lines create enough curiosity, emotion, or surprise to earn the click, your dwell time goes up, which tells the algorithm to keep distributing the post. If people scroll past without clicking, the algorithm reads that as disinterest and slows distribution early. This is why spending more time on your opening lines than on the rest of the post is not an exaggeration - it is genuinely where most of your impression count gets decided. LinkedGrow's hook generator creates six different opening variations per click so you can test different angles before publishing.
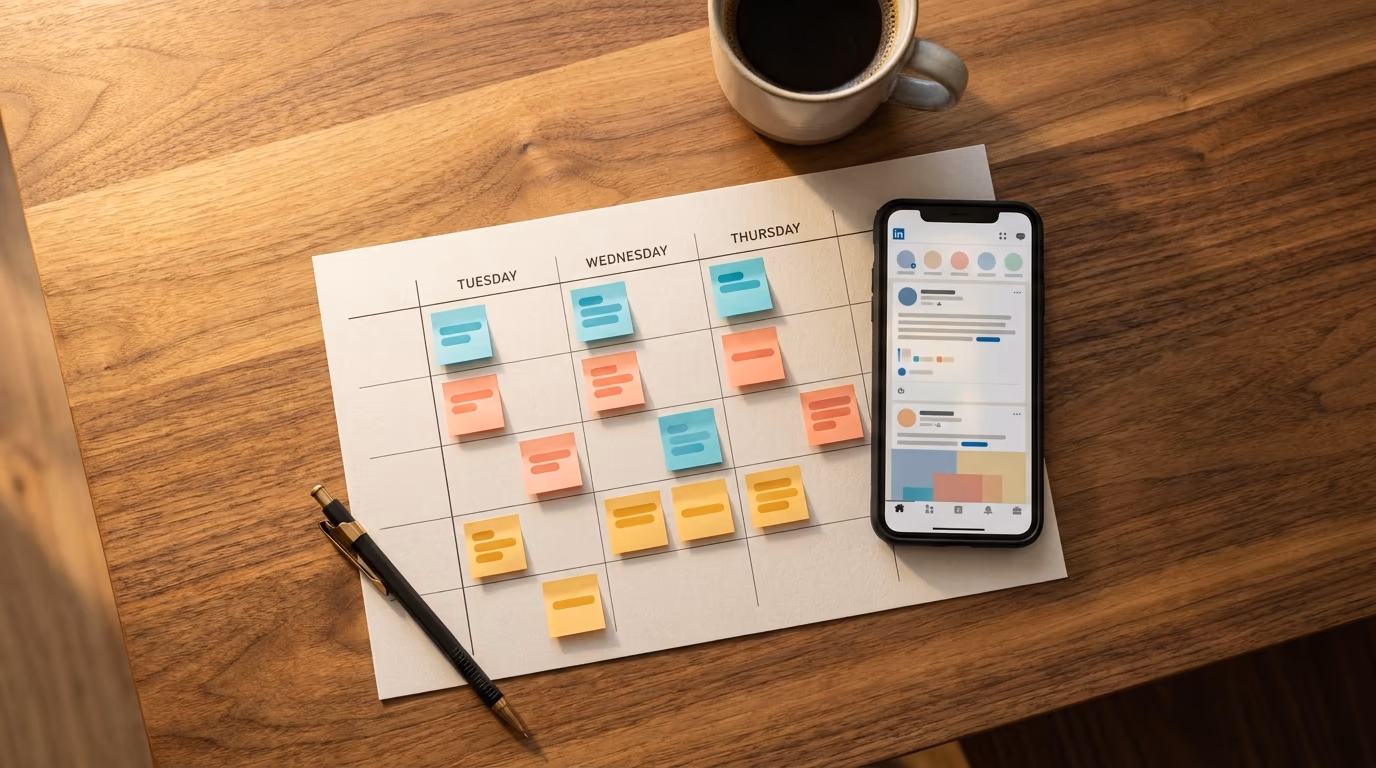
Posting time shapes your initial distribution window. When you publish matters because the algorithm tests your post against a small sample of your network in the first 60 to 90 minutes. If those people are not online during your golden hour, you get lower initial engagement, and the algorithm takes that as a signal to limit further distribution. Publishing when the largest portion of your audience is actively scrolling LinkedIn gives your post the best shot at a strong start, which then compounds into higher total impressions. Use LinkedGrow's best time to post tool to find the optimal window for your timezone and industry.
Comment quality in the first hour is more important than comment quantity. The algorithm now gives significantly more weight to comments that are longer than 15 words compared to short reactions like "great post" or a single emoji. When people leave thoughtful replies and when conversations develop between commenters on your post, LinkedIn interprets that as genuinely valuable content worth showing to more people. This means responding to comments with your own thoughtful replies during the first hour is not just good etiquette - it directly increases your impression count by creating the multi-threaded discussion patterns the algorithm rewards.
Finally, consistency compounds in ways that are not immediately visible. The algorithm tracks your posting cadence and gives a distribution boost to accounts that publish regularly because consistent creators keep people coming back to the platform. If you post three times a week for two months and then go silent for a week, your first post back will typically get lower impressions than the posts you were publishing before the break. It takes a few consistent posts to rebuild that algorithmic momentum. Scheduling your posts in advance is the simplest way to stay consistent without having to remember to publish manually every morning.
How do you track and use your LinkedIn impression data?

Knowing what impressions are is only useful if you actually do something with the data. Most people check their impression count once, feel either good or bad about it, and move on without extracting any actionable insight. The creators who grow consistently treat impression data as feedback that shapes what they publish next, and the tracking process does not need to be complicated to be effective.
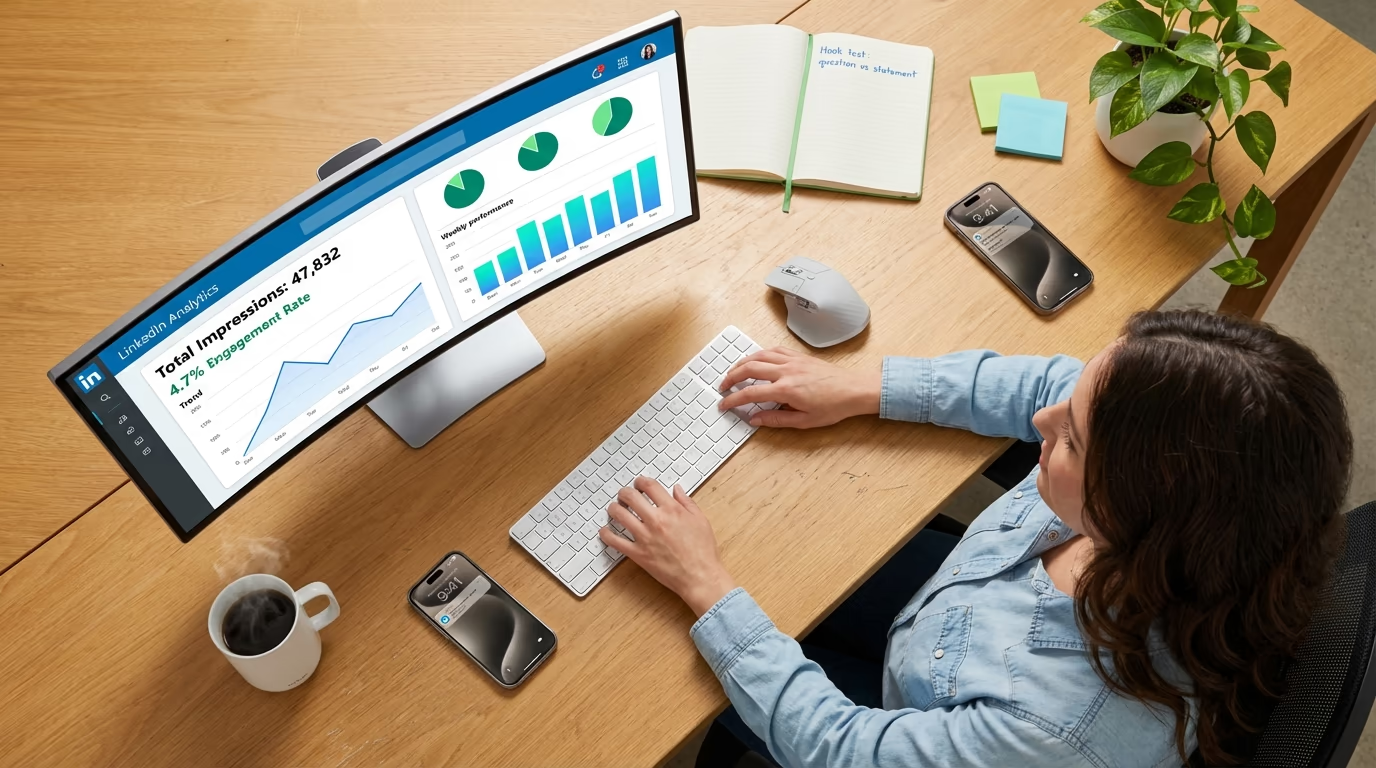
Start by looking at your LinkedIn post analytics, which you can access by clicking the impressions count below any post you have published. LinkedIn shows you total impressions, the number of unique viewers (on company pages), reactions by type, comments, reposts, and clicks. The most useful comparison is between posts you have published in a similar time period - take your last 10 posts and rank them by engagement rate rather than raw impressions. The posts at the top of that list tell you something important about what your audience actually wants to engage with, and the posts at the bottom reveal content patterns you should probably avoid repeating.
Build a habit of logging your post performance weekly. It does not need to be a fancy system - a simple spreadsheet or note with the date, topic, format, impression count, and engagement rate for each post gives you enough data to spot trends within a few weeks. You will start noticing patterns like "my how-to posts consistently get 3x more impressions than my opinion posts" or "posts published on Tuesday morning outperform everything else by a wide margin." Those insights become the foundation of a content strategy that is based on evidence rather than guesswork, and they compound over time as you get better at giving your specific audience what resonates most with them.
One pattern worth watching for is the impressions-to-engagement disconnect. If a post gets unusually high impressions but a lower-than-average engagement rate, it usually means the hook was strong enough to get distributed widely but the body of the post did not deliver on the promise of the opening. The algorithm pushed it because people were clicking "see more," but once they read the full post, they did not find it worth reacting to or commenting on. When you see this pattern, keep the hook style and rework the content approach. Conversely, a post with lower impressions but a very high engagement rate tells you the content was excellent but the hook or timing limited its initial distribution - a stronger opening on the same topic could double or triple the reach next time.
The full LinkedIn analytics guide goes deeper into the other metrics worth tracking alongside impressions, including click-through rate, follower growth rate, and demographic breakdowns. But impressions and engagement rate together give you the core feedback loop you need to improve consistently. Track them, look for patterns, adjust your approach, and repeat.
How do you turn LinkedIn impressions into actual growth?
Impressions are a visibility metric, not a success metric. A post with 50,000 impressions that generates zero profile visits, zero conversations, and zero business opportunities was not a successful post - it was just a widely ignored one. The whole point of understanding impressions is to stop treating them as a vanity number and start using them as a diagnostic tool that tells you whether your content is reaching the right people in the right way and giving them a reason to engage.
The creators who build real audiences on LinkedIn are not chasing the highest possible impression count on every post. They are looking at the relationship between how many people see their content and how many people care enough to respond to it, and they are making small adjustments to improve that ratio week over week. A strong hook, the right posting time, genuine engagement with commenters, and a consistent publishing cadence will move your numbers in the right direction more reliably than any single viral post ever could. With LinkedGrow's AI post generator handling the heavy lifting of content creation, you can focus your energy on the strategic decisions that actually grow your presence on the platform. To track these metrics systematically, check the best LinkedIn analytics tools and find the right dashboard for your workflow.
Frequently Asked Questions
An impression is counted when at least 50 percent of your post is visible on a signed-in member's screen for at least 300 milliseconds, or when someone clicks on the post. The same person seeing your post twice counts as two impressions since they are not deduplicated.
LinkedIn changed how impressions are counted by including impressions that come from other people reposting your content. If someone reposts your update and their audience sees it, those views now count toward your impression total, which inflated numbers for many creators compared to previous years.
A strong engagement rate on LinkedIn typically falls between 3 and 6 percent, calculated as total engagements divided by impressions times 100. Document posts and carousels tend to earn the highest rates, while link posts with external URLs usually perform lowest.
No. Impressions count every time your post appears on someone's screen, including repeat appearances to the same person. Views are used specifically for video and article content and require a longer viewing threshold, usually at least three seconds for video.
Focus on writing strong opening hooks that earn the see-more click, post when your audience is most active, respond to every comment in the first hour to boost algorithmic distribution, and publish native content rather than external links. Consistency matters more than any single tactic.