If you want to learn how to A/B test LinkedIn posts and measure what works, you're probably tired of publishing content that gets wildly inconsistent results with no clear explanation why. You posted something last Tuesday that got 8,000 impressions and 47 comments, then followed it up on Thursday with something you thought was even better - only to land at 900 impressions with three likes from people who were probably just being polite. LinkedGrow's built-in A/B testing exists to solve exactly this problem, but before we get into the tool, you need to understand the methodology behind effective content testing on LinkedIn.
Most LinkedIn creators treat every post like a one-off experiment where they change five things at once and then attribute the result to whichever variable feels most intuitive. They switched the hook, rewrote the CTA, posted at a different time, used a carousel instead of text, and included three hashtags instead of five. When the post performs well, they assume it was the hook. When it flops, they blame the algorithm. Neither conclusion is useful because neither is based on anything resembling controlled observation.
A/B testing is the practice of changing one thing at a time between two otherwise identical posts so you can isolate exactly which variable drove the difference. It's the same methodology that product teams at every serious tech company use to optimize their landing pages, email subject lines, and ad creatives, and it works just as well for organic LinkedIn content if you approach it with a little bit of structure. The good news is that you don't need a statistics degree or expensive software to start running meaningful tests on your LinkedIn posts, and tools like LinkedGrow's A/B testing feature make the process almost effortless once you understand the fundamentals.
This guide covers what to test, how to run clean experiments, how to read your results, and the mistakes that silently invalidate most people's tests before they even finish collecting data.
Why does guessing what works cost you LinkedIn reach?
LinkedIn's algorithm has gone through significant changes in 2026, and the biggest shift is that the platform now heavily rewards dwell time and saves over simple likes. A post that earns 30 seconds of reading time from each viewer will outperform one that collects 50 quick likes, because LinkedIn's new 360Brew ranking system prioritizes signals that indicate genuine interest rather than passive acknowledgment. This means the old instinct of writing for reactions is actively hurting your reach, and most creators don't even realize their content strategy is optimized for a version of the algorithm that no longer exists.
The problem with guessing is that your intuition is shaped by what used to work, not what works right now. You might believe that short punchy posts outperform long-form content because that was true two years ago, but the data in 2026 tells a different story where posts between 1,000 and 1,400 characters consistently generate more meaningful engagement than either very short or very long content. Without testing, you'd never discover that your audience specifically responds better to numbered frameworks than open-ended questions, or that posting at 10 AM on Thursdays beats your usual 8 AM Tuesday slot by a wide margin.
The creators who consistently grow on LinkedIn aren't the ones with the best instincts or the most creative ideas, they're the ones who systematically test their assumptions and let the data override their gut feelings. Every post you publish without a testing framework is a missed opportunity to learn something specific about your audience, your content, and the way the algorithm treats your account. Over six months of disciplined testing, the compound effect of these small, data-driven improvements is the difference between steady growth and the frustrating plateau that most LinkedIn users hit around the 2,000 to 5,000 follower mark.
And here's what makes this particularly urgent right now: LinkedIn's algorithm is actively penalizing engagement-bait prompts and rewarding genuine, high-quality content. The game has shifted from "how do I get clicks" to "how do I create content worth saving," and A/B testing is the fastest way to figure out what your specific audience considers worth saving.
Which 6 variables are worth A/B testing on LinkedIn?
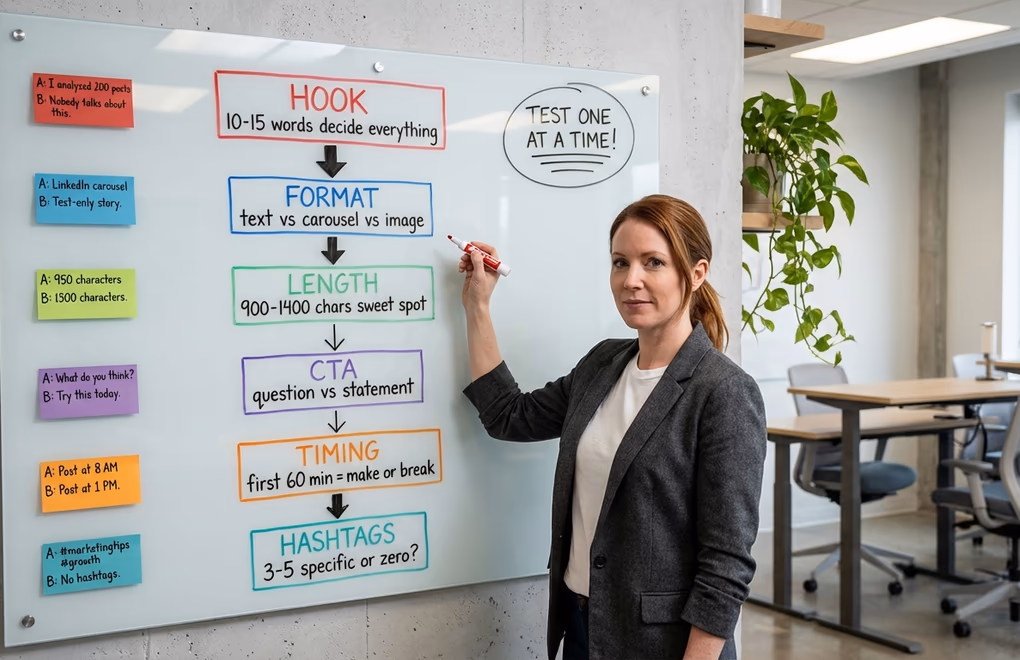
Not everything in your LinkedIn post is worth testing, and if you waste your limited posting slots testing variables that barely move the needle, you'll burn through weeks of content without learning anything useful. Based on how the algorithm actually distributes content in 2026, here are the six variables ranked by their impact on your post's performance, from highest to lowest.
1. The Opening Hook
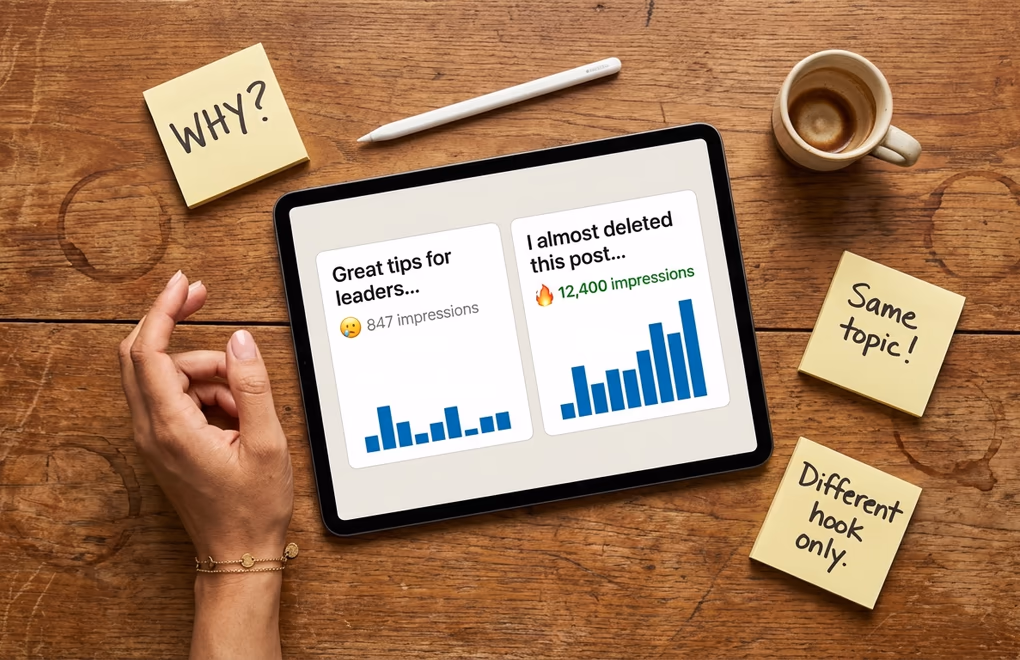
Your hook is the single most important variable to test because it determines whether anyone sees the rest of your post at all. LinkedIn shows approximately two lines on mobile before the "see more" button, which means your entire post's reach is decided by roughly ten to fifteen words. I've seen the same body content perform 7x differently with two different opening lines, which is a bigger swing than any other variable can produce. Test curiosity-driven hooks against specific-number hooks, test personal vulnerability hooks against contrarian opinion hooks, and test question-based hooks against statement-based hooks. The LinkedIn hook generator can create multiple variations of the same concept so you always have options to test against each other.
2. Content Format
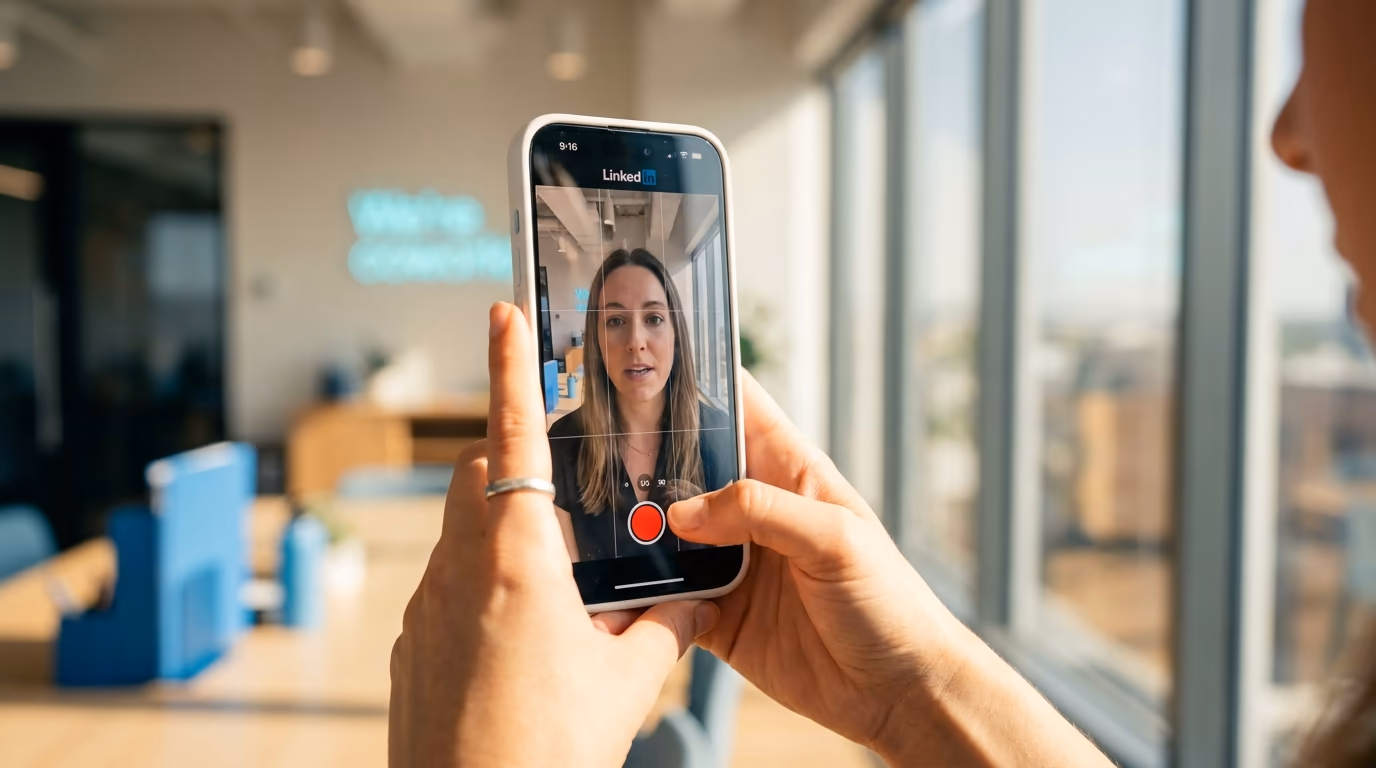
Document carousels currently generate the highest engagement rates on LinkedIn, but that doesn't mean they're the best format for your specific audience. Some niches respond better to text-only posts because the audience values substance over visual appeal, while others engage more heavily with carousels because the swipeable format matches how they consume information. Test the same core message as a text post, an image post, and a carousel to find out which format your followers prefer, and don't assume the platform-wide averages apply to your account.
3. Post Length and Structure
Post length directly affects dwell time, which is now one of the most heavily weighted LinkedIn ranking signals. But longer isn't automatically better because a 2,000-character post that loses the reader at paragraph three generates less dwell time than a tight 900-character post that holds attention all the way through. Test different lengths with the same topic and measure not just impressions but the ratio of engagement to impressions, which tells you how much of your audience actually read deeply enough to react. The structure matters as much as the length - try the same content as flowing paragraphs versus numbered sections versus short paragraphs with lots of white space, since each formatting approach changes how readers scan and absorb your content.
4. Call to Action
The way you end your post has a disproportionate impact on whether people engage, but the LinkedIn algorithm in 2026 is actively penalizing obvious engagement bait like "Comment YES if you agree" and "Like if this resonated." The tests worth running here are genuine questions versus no CTA at all, save-worthy content summaries versus conversation starters, and direct asks versus implied engagement opportunities. A post that ends with a genuinely thought-provoking question tied to the reader's own experience will outperform one that begs for a comment, and the only way to find the right tone for your audience is to test it.
5. Posting Time
The first 60 minutes after publishing are critical because LinkedIn makes its initial distribution decision during this window, and posts that don't gain traction early rarely recover. Testing posting times means publishing the same quality of content at different times and tracking which slots give you the strongest first-hour engagement. The general guidance says Tuesday through Thursday mornings perform best, but your audience might be concentrated in a different timezone or have a habit of scrolling during their lunch break, and you won't know without testing. Use post scheduling to publish at precise times rather than whenever you finish writing, so the timing variable is actually controlled.
6. Hashtag Strategy
Hashtags on LinkedIn are the most debated and least understood variable, largely because their impact varies dramatically depending on your account size and niche. The consensus for 2026 is to limit yourself to three to five specific hashtags rather than broad ones, but some creators report better results with zero hashtags because the algorithm has become sophisticated enough to categorize content without them. Run a month of tests comparing posts with three targeted hashtags, five broad hashtags, and no hashtags at all, and let the engagement data settle the debate for your specific account.
How do you run a clean A/B test without LinkedIn Ads?
Most articles about LinkedIn A/B testing focus on paid advertising campaigns, which is unhelpful for creators and thought leaders who are building organic reach. Running A/B tests on organic LinkedIn posts requires a slightly different approach because you can't split your audience into two random groups the way you would with a paid campaign. Instead, you're using sequential testing - publishing two variations at similar times on different days and comparing the results while controlling for as many external factors as possible.
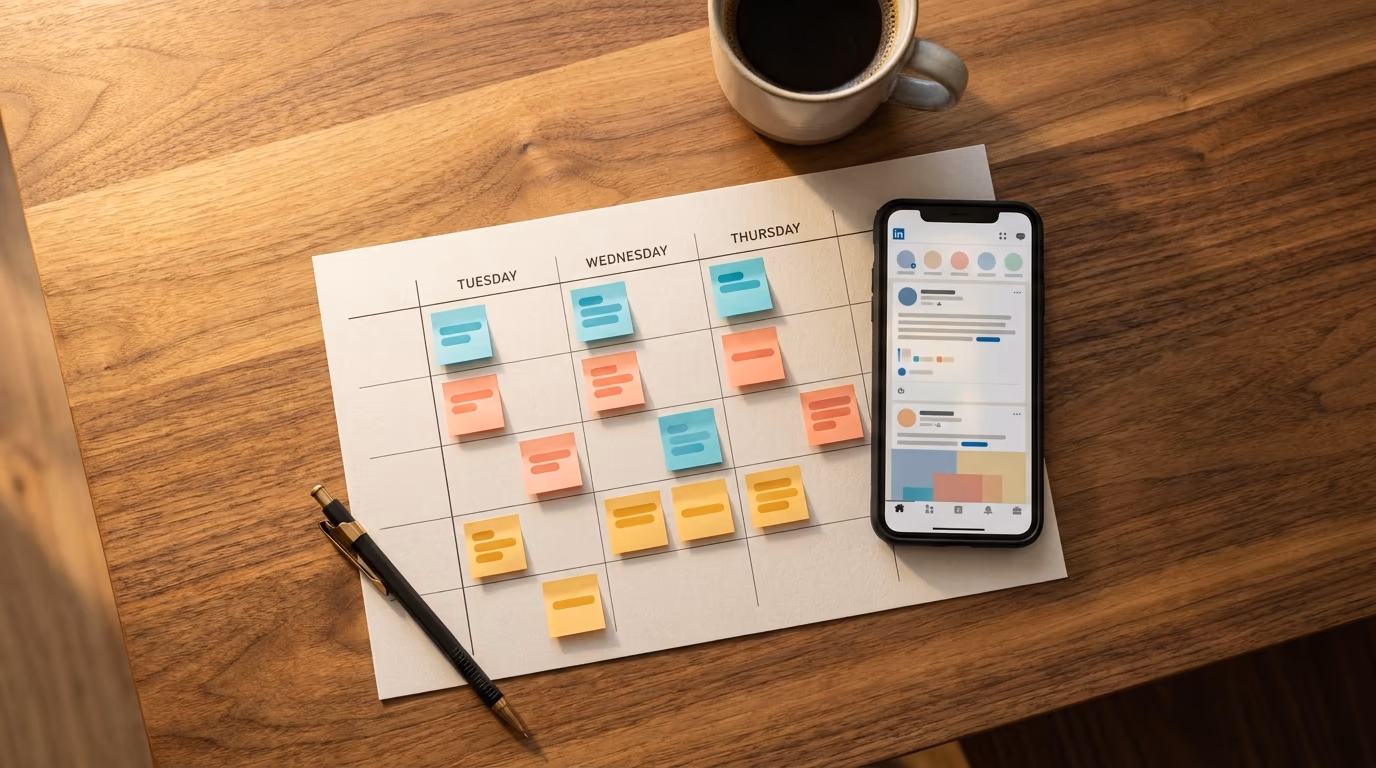
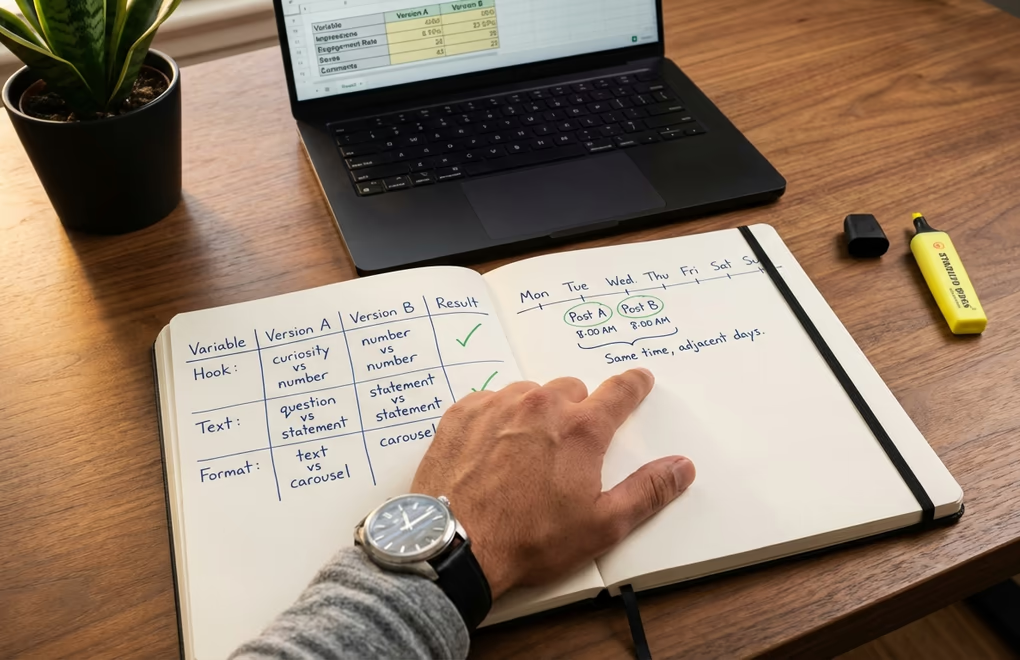
Start by choosing one variable to test and keeping everything else identical. If you want to test hooks, write two versions of the same post where the only difference is the opening two lines, and publish Version A on Tuesday and Version B on Wednesday at the same time. The body, the CTA, the formatting, and the hashtags should be identical so that any difference in performance can reasonably be attributed to the hook rather than some other change you made without thinking about it.
The biggest mistake people make with organic testing is not controlling the timing variable. If you publish Version A on a Monday morning and Version B on a Friday afternoon, you're not testing your variable at all because the difference in reach between Monday morning and Friday afternoon can easily overshadow whatever change you made to the content itself. Test on adjacent weekdays at the same time - Tuesday and Wednesday, or Wednesday and Thursday - to minimize the timing noise. Avoid testing across a weekend because Monday and Friday audiences behave very differently from mid-week audiences.
Keep a simple spreadsheet or use a tool like LinkedGrow's A/B testing dashboard to track each test. Record the variable you changed, the two versions, the posting times, and the results after seven days. Seven days matters because LinkedIn continues distributing posts well beyond the first 24 hours, and posts that earn saves and meaningful comments days later can see significant late-stage reach boosts that you'd miss if you checked results after just 48 hours.
Run at least three to five rounds of the same test before drawing firm conclusions. A single pair of posts doesn't tell you much because any individual post's performance is subject to randomness - your audience might have been busy that day, a major news event might have dominated the feed, or the algorithm might have simply surfaced different content to your followers. Multiple rounds smooth out this noise and give you a pattern you can actually rely on when making content decisions going forward.
How do you read A/B test results and know when to trust them?
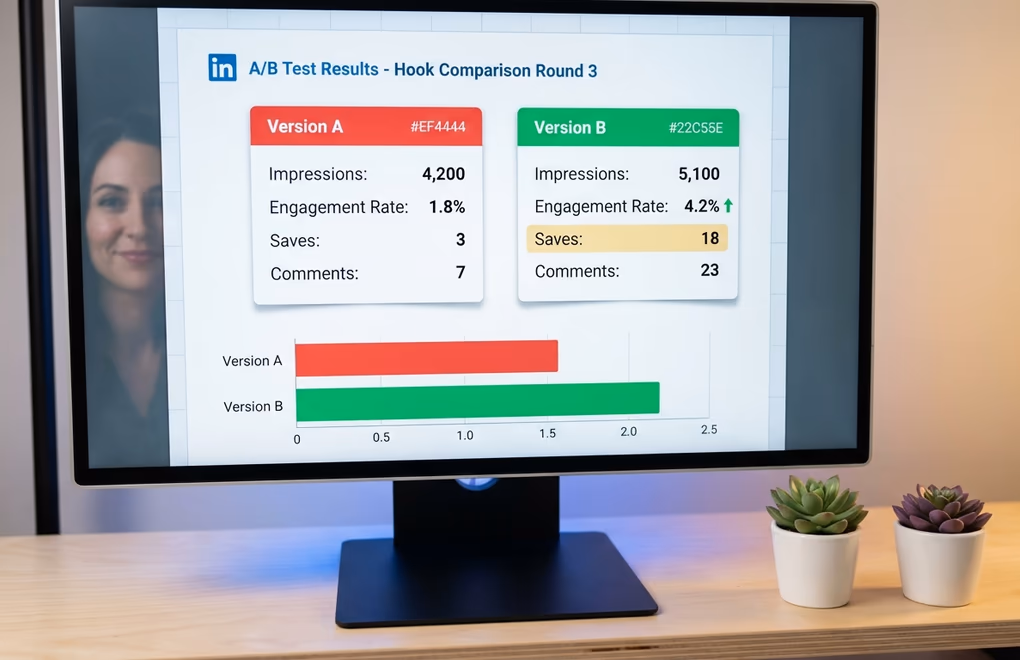
Raw impression numbers are the most misleading metric you can use to judge a test because they measure distribution, not quality. A post with 10,000 impressions and 30 reactions has an engagement rate of 0.3%, while a post with 3,000 impressions and 90 reactions has a rate of 3% - ten times better despite reaching fewer people. Engagement rate is the primary metric you should compare between test variations, because it tells you how compelling the content was to the people who actually saw it rather than how many people the algorithm happened to show it to. The free LinkedIn engagement rate calculator gives you the formula plus industry benchmarks so you can tell whether a 2% rate is great or mediocre for your niche.
But in 2026, not all engagement is weighted equally by the algorithm, and your test analysis should reflect that. Saves now drive roughly five times more reach than a like, and comments drive about three times more reach than likes alone. So if Version A gets 50 likes and 2 saves while Version B gets 30 likes and 12 saves, Version B is actually the stronger performer even though its total reaction count is lower. Pay attention to the type of engagement, not just the volume, because the algorithm certainly does.
The question everyone asks is "how big does the difference need to be before I trust it?" and the honest answer for organic LinkedIn testing is that you're never going to achieve the kind of statistical rigor that a product team at Google would demand. You're working with small sample sizes, uncontrolled variables, and an algorithm that treats every post differently based on factors you can't observe. A practical rule of thumb is that if you see the same variable win three out of four rounds of testing, the pattern is strong enough to act on even if any individual round could have been influenced by randomness. If your results are split 2-2 or the differences are tiny, the variable probably doesn't matter much for your audience and you should move on to testing something else.
One more thing to track that most people overlook: profile visits and follower growth per post. A post might generate modest engagement but drive an unusually high number of profile visits, which often correlates with quality audience growth rather than the kind of empty virality that inflates your numbers without building anything meaningful. LinkedIn shows you profile views in your dashboard analytics, and spikes in profile visits after specific posts are some of the most useful signals you can find in your testing data. The LinkedIn analytics metrics guide goes deeper into which numbers actually predict growth versus which ones just feel good to look at.
Which 5 mistakes silently ruin LinkedIn A/B tests?
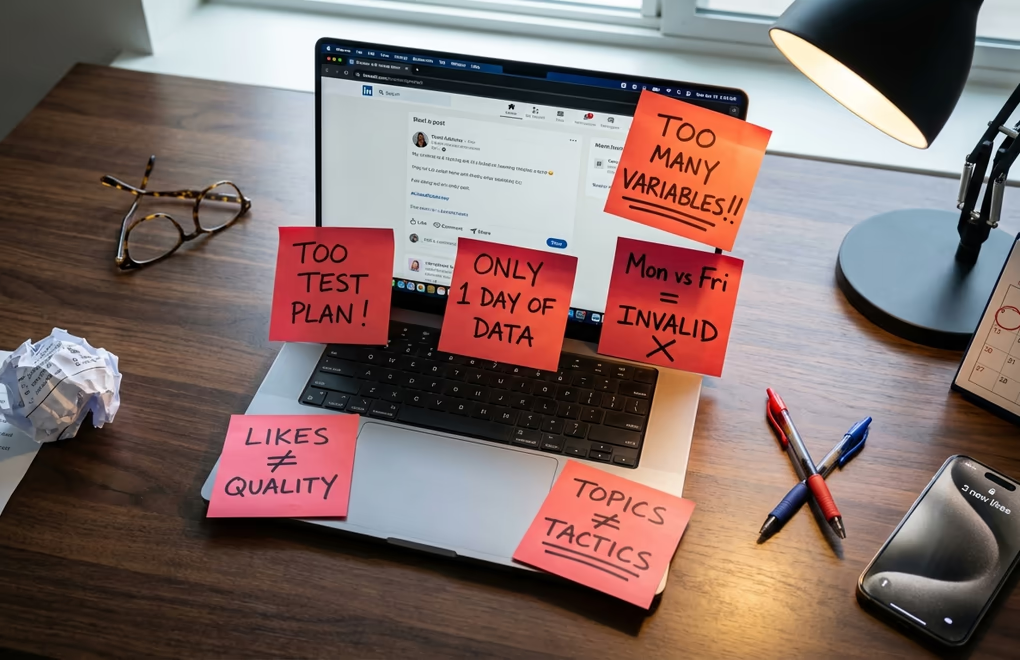
The most dangerous testing mistakes aren't the obvious ones. They're the subtle errors that make you feel like you're learning something when you're actually just collecting noise and turning it into false confidence. Here are the five that invalidate most organic LinkedIn tests.
Changing multiple variables at once is by far the most common mistake, and it happens because people get excited about improving their content and can't resist tweaking everything between versions. You changed the hook, shortened the post by 400 characters, and swapped the CTA from a question to a statement. Version B performs 3x better, and now you have absolutely no idea which change caused it. Was it the shorter length? The new hook? The different CTA? You can't know, which means you can't replicate the result, which means you haven't actually learned anything. Discipline yourself to change exactly one element per test, even when it feels painfully slow, because slow and accurate beats fast and meaningless every single time.
Testing on wildly different days or times is the second biggest problem. Publishing Version A on a Tuesday morning and Version B the following Monday afternoon introduces so much timing noise that your variable barely matters. Audience composition shifts throughout the week, with more senior professionals active mid-week and more casual browsers on Mondays and Fridays, so a post that "won" might have simply been published at a better time. Keep your test pairs within 24 to 48 hours of each other and post at the same time of day.
Declaring a winner after one round is tempting but statistically meaningless. A single post's performance is influenced by so many random factors that one data point tells you almost nothing about the underlying pattern, and if you change your entire content strategy based on a single test you're building on sand. Run a minimum of three rounds of each test before making permanent changes, and even then, revisit your assumptions quarterly because the algorithm and your audience both evolve over time.
Ignoring the quality of engagement is a mistake that comes from treating all reactions as equal. Fifty likes from people who scrolled past in two seconds are worth less to the algorithm than five thoughtful comments from people who read every word and then shared the post with their own commentary. When comparing test results, weight your analysis toward comments, saves, and shares rather than raw likes, because those are the signals that LinkedIn uses to decide whether your content deserves wider distribution.
Testing topics instead of tactics is a subtle error that confuses what your audience cares about with how you present what they care about. If you test a post about leadership against a post about productivity and the productivity post wins, you haven't learned that productivity is a better topic - you've learned that that specific productivity post happened to perform better, probably because of how it was written rather than what it was about. Keep your topics consistent within a test and only vary the tactical elements like hook style, format, structure, and CTA approach.
How LinkedGrow Turns A/B Testing Into a Simple Workflow
Manual A/B testing works, but it's tedious enough that most people give up after two weeks because the overhead of tracking spreadsheets and timing post pairs perfectly is more effort than they bargained for. That's exactly why we built A/B testing directly into LinkedGrow as a core feature of the Business plan - to handle the structural discipline so you can focus entirely on creative decisions.
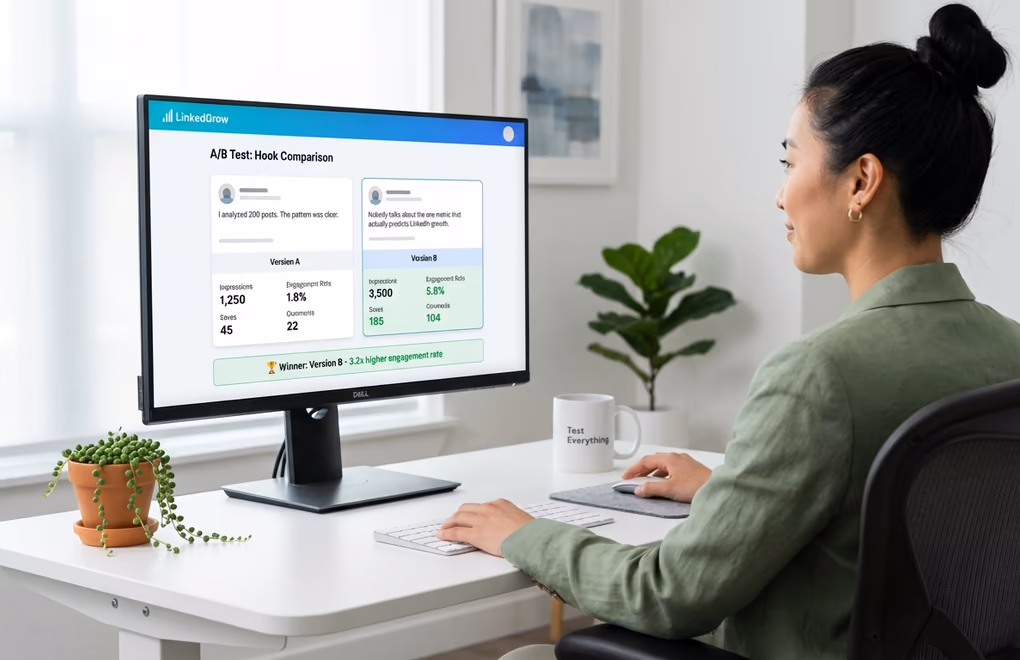
The workflow is straightforward. You write your original post, then create a variation where you change the one element you want to test. LinkedGrow schedules both versions at comparable times, tracks the full seven-day performance window for each version, and presents the results side by side with the engagement metrics that actually matter - not just likes and impressions, but the weighted engagement signals that reflect how the algorithm scores your content. You see exactly which version drove more saves, more substantive comments, more profile visits, and more follower growth, so the "winner" is based on real business outcomes rather than vanity numbers.
The real power shows up over time. After running ten or fifteen tests, you start building a testing library of proven insights that's specific to your audience and your niche. You know that vulnerability hooks outperform data hooks for your followers by 2x. You know that your audience prefers text posts on Tuesdays and carousels on Thursdays. You know that ending with a genuine question drives three times more comments than ending with a bold statement. These are insights no generic LinkedIn advice article can give you because they're unique to how your specific audience consumes content.
And because LinkedGrow uses the BYOK model for AI generation, creating test variations doesn't cost you extra credits or bump you into a higher pricing tier. You can generate five different hook variations for the same post body using your own API key, pick the two most different approaches, and run the test without worrying about burning through a limited monthly allotment of AI generations. The AI post generator already knows your voice from the training samples, so each variation sounds like you rather than like a generic AI rewrite, which means your test is comparing hooks and tactics rather than accidentally testing "authentic voice versus robot voice."
Start With One Test This Week
You don't need to redesign your entire content strategy to start benefiting from A/B testing. Take your next LinkedIn post, write two different hooks for it, and publish them on consecutive days at the same time. Track the engagement rate, the saves, and the comments on each version, and after seven days you'll have your first real data point about what makes your audience stop scrolling. That single insight is worth more than a hundred generic "best practices" articles because it comes from your followers, your niche, and your writing style.
If you want to skip the spreadsheet tracking and get structured A/B testing with automatic result comparison, LinkedGrow's Business plan includes everything you need to run, track, and learn from your tests without any of the manual overhead. Either way, the creators who test their content will always outperform the ones who guess, and the gap between those two groups is only getting wider as LinkedIn's algorithm becomes more sophisticated about rewarding genuine quality over engagement tricks.
Frequently Asked Questions
There is no magic number, but you need enough impressions for the difference to be meaningful rather than random. For most LinkedIn creators, that means at least 500 impressions per version before drawing conclusions. Smaller accounts should extend their testing window to accumulate enough data over multiple posts.
You can run manual A/B tests by publishing two similar posts on different days and comparing results in LinkedIn analytics. The downside is that timing differences and audience mood introduce noise. A dedicated tool like LinkedGrow removes those variables by structuring the test and tracking results automatically.
Your opening hook has the largest impact on overall performance because it determines whether anyone reads the rest of your post. LinkedIn shows roughly two lines before the see more button, so those first ten to fifteen words control your entire reach and engagement outcome.
Give each test at least five to seven days before declaring a winner. LinkedIn distributes posts over 48 to 72 hours, and posts that receive saves or comments days after publishing can see significant late-stage reach boosts. Cutting a test short means you miss the delayed engagement signal entirely.
Always test one variable at a time if you want clear answers. When you change the hook, the format, and the CTA simultaneously, you have no way of knowing which change drove the result. Single-variable tests take longer but produce insights you can actually trust and repeat.